As the bounty of Spring yields a cornucopia of pollen and regrowth, many homeowners revisit the familiar and disappointing impasse that they are in fact not the CEO of their own garden. Even though they are abound with wisdom, over the years they have been relegated to a middle management position by the dulling cycle of relying on regular visits by professionals to care for the yard. This fabricated detachment is unfortunate, as working outdoors is a fulfilling and stress relieving activity, and a simple weekend of productive labor can release those endorphins, and get the creative juices flowing.
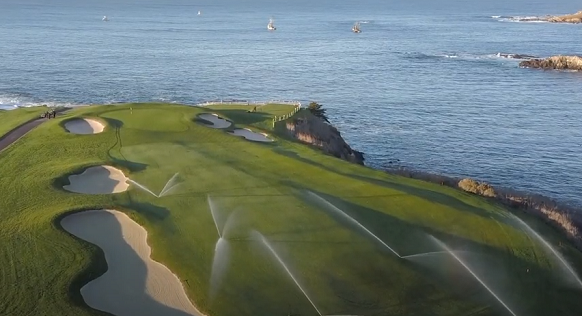
With Summer right around the corner, gaining knowledge of how water interacts with your property in sustaining the blooms and greens of turf, ornamentals, trees, and shrubs, is an easy way to claim a seat on the board of directors, and have more than an advisory role when dealing with your irrigation contractor in making executive decisions. Understanding of the engineering basics of smart irrigation, will go along way in propagating a rewarding and sustainable relationship with your plants that is based on actual proven research by professionals not pushing an end of the world agenda by exploiting the Green movement for personal political and financial gains. The symphonic arcs of sprinkler cooling sprays creating an orchestra with the lush evening garden after a day of relentless Summer golden radiation is a spectacle cherished in suburbia.
It’s All in the Soil
Identifying soil dynamics is the basis for establishing water requirements for the entire property. Learning the process will also give you ammunition when dealing with pesky neighbors who routinely use the term “science” as slang when forwarding an agenda that they know absolutely nothing about below a superficial level of rhetoric. Clay laden soils will have a high water retention capacity, while sandy mixtures will require more watering cycles in preventing wilt. The official measurement used to determine soil moisture capacity is called Available Water (AW), and is represented in inches per inch. For example, a clay-loam mixture will have a holding capacity of .17in/in, while on the other side of the spectrum sand will have a fraction of that amount at .06in/in. Interestingly, the infiltration rate of sand is 10 times that of clay, which is an important correlation when planning for the potential of runoff. Numbers and data aside, the bottom line is that a balanced soil profile is conducive for a healthy landscape, and the majority of plant species outside of desert flora in North America prefer a balanced mixture of clay, loam, and sand, as does a reasonable water bill. Obviously, PH is a crucial component of soil characteristics, and will be addressed in a future article pertaining to soil and plant health indicators.
A fun and painless science project for the family is to take a soil profile from various parts of the yard to determine the specific characteristics of the dirt. All you need is an empty mason jar and dishwasher detergent. Use a small shovel hand shovel and dig four or five inches into the ground, dump the sample in the mason jar, fill the container to three quarters full, add a tablespoon of the dishwater detergent and shake vigorously. Let sit overnight, and the soil constituents will be arrange themselves in layer, with coarse particles and sand at the bottom, loam in the middle, and the larger and fine clay molecules settling on the top. Measuring the layers can give you a rough idea of your dirt in having a better understanding of how to subsequently water.
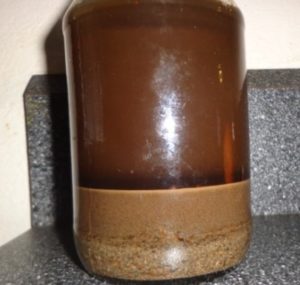
A DIY soil profile in a recycled Adams peanut butter jar. Notice the prevalence of clay and fine particles.
Basic Scheduling Dynamics
Unfortunately, you are bound by the design of your irrigation infrastructure, and the strengths and limitations of your sprinkler components as well. garnering a perspective of what you have to work with is an simple way to save money by being able to identify known issues and take action. Do a simple walk around of your property and locate the backcheck valve, control valves and separate stations, and the programming of the central irrigation control. Ensure that your system PSI is up to specifications for the the various sprinkler heads, and optimal flow rate charts are available digitally with every major manufacturer.
Familiarize yourself with your central controller and check to see when watering events are schedule and for the duration each is programmed. This can lead to an immediate adjustment that will increased efficiency and cut down on the utility bill. For stations set to run a :30-minute block, break down the total time to run in smaller increments throughout the course of the day scheduled. This method is known as cycle-and-soak and keeps soil pliable and moist. The :30-minute block could be broken down into 5 cycles at :6 minutes, and equates to perceptible savings per month in deploying the first layer of advanced sprinkler metrics, in an innovative approach to irrigating.
Introduction To Advanced Performance Measurements
On paper, sprinklers are calibrated to have a baseline efficiency and uniformity in delivering water if operating within water pressure specifications. These attributes can be measured by conducting sprinkler performance catch can testing on your lawn areas, of water that actually reaches the surface of the landscape. Simply put a series of catchment devices with the same dimensions in multiples of four (can be a keg cup) in a grid pattern with one each at every sprinkler head, and three in between under 30′ spacing between sprinklers and four if over ’40 feet spacing. Run the zone for 10 minutes and measure how much water each catchment device collected. For example in a 60 feet by 16 feet irregular trapezoid shaped turf area in clay-loam soil, the homeowner placed six cups next to each sprinkler and 26 total covering the entire lawn area, and ran the station for 10 minutes on a sunny dry day with nominal wind. The results were intriguing.
The average amount collected in each cup was .55 inches. To find the net precipitation rate, and determine if the sprinklers are interacting well with the landscape, the homeowner then converted the average measurement to millimeters. She then measured the diameter of the top of a cup at 4 inches and converted it to a total area. The net precipitation rate was calculated to be .26 inches and with the variance of irrigation water captured in each cup, she was able to give her zone a performance score.
Catch throat area (CTA): Diameter of catchment device in inches squared x .785: 4^2 x .785 = 12.56
Catchment measurement average (CAVG): total measurement divided by number of catchment devices: 17.6in / 32= .55in
CAVG converted to milliliters: .55 x 16.387= 9.0128ml
Net Precipitation Rate (PRnet): 3.66 x .55in (CAVG) / Run time 10 X 12.56 (CTA) = .26
Lowest quarter average (LQ): total measurement of lowest quarter catchment devices (in the above example this would be 8): .35 x 16.387= 5.7354ml
Distribution Uniformity: LQ / CAV: 5.7354ml / 9.0128 ml= 64%
The “D” grade score is not a travesty equating to a complete teardown and allows for slight adjustments and improvements to be made in hopefully increasing the DU percentage into the mid to high 70’s. While our hypothetical gardener did not encounter any dead spots or patches of mustard, she was interested to discover the her entire lawn was plagued by micro-instances of excessive and limited watering which did compromise the appearance. Her calculations facilitated a campaign to tweak the 6 rotor heads, and further calculations inspired changes to station runtime which resulted in $10 of savings per month alone in keeping the front lawn green throughout the dry season.
—
This feature powered by Duckduckgo.com